|
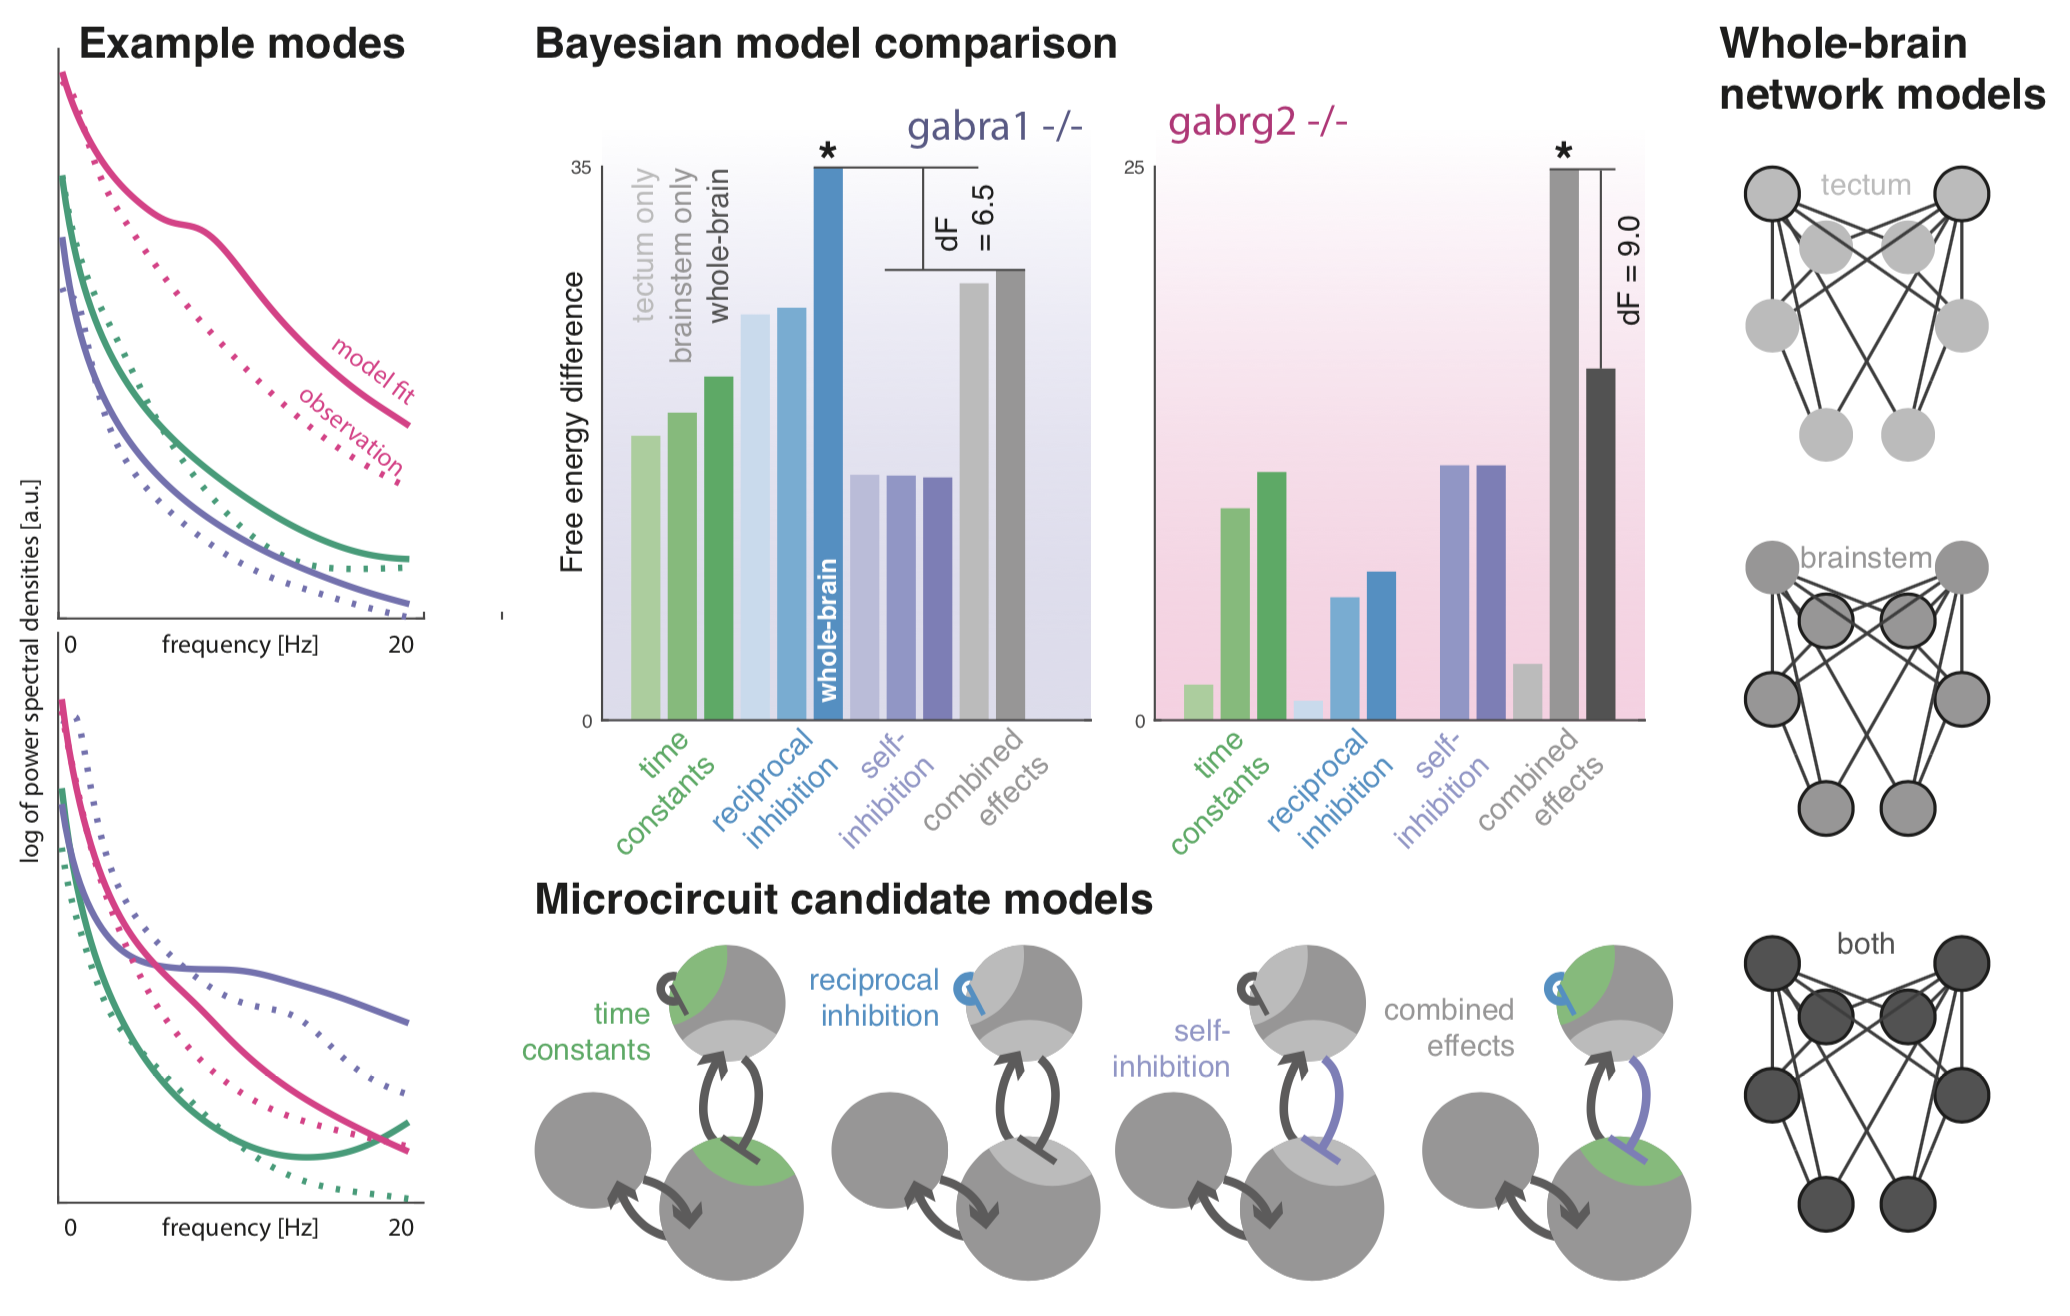
[Left] Networks of coupled neural masses are fitted to 1 minute worth of data recorded from 4 minutes after the light exposure (to capture steady state responses). These fitted models capture key differences between the phenotypes. [Right and Center Bottom] To assess whether the main deviations of the two mutant genotypes from wildtypes between conditions can be explained with subsets of parameters, we compared combinations of models across two model families - one (right) where parameters only vary in restricted parts of the anatomy; and one (bottom) where only some aspects of local inhibition are altered by the mutations. |
[Center Top] This graph shows the Bayesian model comparison across reduced models that best explain the effects of mutation on steady state power spectra for the two mutations separately. |